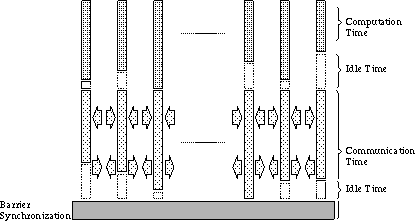
Figure 1: Superstep structure.
A post-mortem call-graph profiling tool has been developed which analyses trace information generated during the execution of BSPlib programs. The parts of the program to which profiling information is assigned are referred to as `cost-centres'. For each cost-centre in the program, that is the textual position of a bsp_sync call, the following information is recorded: (i) accumulated computation time; (ii) accumulated communication time; (iii) accumulated idle (waiting) time; and (iv) accumulated h-relation size. The total elapsed time spent at a cost centre is simply the sum of the accumulated maximum communication and computation times.
The purpose of the profiling tool is to expose imbalances in either computation or communication, and to highlight those imbalances which are amenable to improvement. It is clear from the BSP cost formulae for program execution that balance is the key to good BSP design:

Figure 1 above shows a schematic diagram of a BSP superstep and its associated costs. As can be seen from the diagram, idle time can arise in either local computation or communication. For computation, idle time arises when processes have to wait at a barrier synchronisation for the process with the largest amount of work to arrive. Alternatively, idle time may occur during the communication phase of a superstep, as processes have to wait until all processes finish communicating before safely proceeding into the next superstep.
For each cost-centre, p costs are recorded, one per process. This data is presented to the user in one of two ways:
The accumulated cost within a single cost-centre can be summarised in terms of maximum (the standard BSP interpretation of cost), average, and minimum accumulated costs associated with each of the p processes. More formally, given that a program may pass through a particular cost centre x times generating a sequence of costs < C^1, ..., C^x >, the accumulated computation cost for the given cost-centre is given by the formulae (where w^k_i is the cost of local computation for superstep k on process i):
| maximum cost | = | Sum (Max { w^k_i | 0 <= i < p }) | (1) |
| average cost | = | Sum (1/p * Sum { w^k_i | 0 <= i < p }) | (2) |
| minimum cost | = | Sum (Min { w^k_i | 0 <= i < p }) | (3) |
Similar formulae exist for communication time, idle time, and h-relation size.
The cost associated with each of the p processes is presented to the user as a pie chart. Care has to be taken when interpreting the results shown in this manner as the cost is calculated using a formulae that differs from the standard BSP interpretation of cost. The motivation is that the effect of visualising a pie-chart is to identify the largest (maximal) segment in the chart. The size of this segment is:
| MAX { Sum w^k_i | 0 <= i < p } | (4) |
which is different from the maximum identified by the prior analysis. As can be clearly seen from equations 1 and 4, the latter equation abstracts the maximum outside the summation, which produces a result that might be smaller than that obtained from the former equation. Although this interpretation is not strictly in line with BSP cost analysis, it is useful in identifying the process that might be causing the bottleneck.